Climate alarmism continues to be a growth industry in many parts of the world. There are riots in France over proposed fuel tax increases to comply with the Paris Agreement. The UN just kicked off a 60 day climate conference in Polish coal country, where I’m sure everyone that is going to attend will be traveling in zero-emission conveyances, and not the private jets that are usually used. And of course, the Fourth National Climate Assessment predicts that we’re all going to die if don’t … something.
As you might guess, Gentle Reader, I am a bit of a climate alarmism skeptic. I use the term “climate alarmism” deliberately, because “climate change” is freighted with ontological weight and yet is essentially meaningless. So, because my mind is swiss cheese and I tend to forget where I found things, I thought I would lay out some points that I think are fairly determinative in the debate (to the extent that debate is still permitted, the science being settled* and all).
Lest you think that I am doing the interpretive dance of the ostrich, studiously ignoring the debate in favor of ignorance, let me make the following statements that form the basis upon which my skepticism rests:
- Climate change is real. The climate is changing, the climate has changed, and the climate will change. Climate change is a natural phenomenon that needs to be understood in order to inform policy decisions.
- Human activity has some effect on climate. Building cities, paving roads, growing crops, raising animals, and industrialization make some contribution to both local and global climate conditions.
- We don’t know how much effect those anthropogenic additions have on climate, either locally or globally.
- Policy decisions regarding human activity have to be made based on the best information and data available.
- Climate models are imperfect.
Here’s my problem: the data don’t match the models. Predictions of future temperature increases, and all of the adverse effects that are predicted to arise from that increase, are based on climate models. Climate is, of course, a vast and complex system, and there are a multitude of inputs that need to be considered when building a climate model. I don’t pretend to be able to understand how the models are constructed, or what estimates of solar irradiance (or solar constant), albedo, radiative forcing or other factors are computed or used. As with any model, changes to any of the inputs will affect, to a greater or lesser extent, the output.
As a non-scientist, I will accept that the models are designed with specific assumptions about the variables built into the models, and that significant and intelligent thought and theory are used to substantiate the assumptions. So, since I don’t have the background to critique the inputs of the models, I have to look at the outputs. As we know, the scientific method can be best understood as a process. The experimenter makes conjectures (hypotheses), derives predictions from them as logical consequences, and then carries out experiments based on those predictions to determine whether the original conjecture was correct. Since we are dealing with an area (climate predictions) that doesn’t lend itself to experimentation, modeling is substituted for the experimentation component of the process. As such, the outputs of the model should be then be compared to any known facts to validate or invalidate the model. In this case, the data are the outputs of the model, as compared to known climate outcomes, or as we rubes like to call it, the weather.
We are fortunate to live in an era where weather data collection is robust and extensive. One of those robust data sets are the mid-troposphere temperature records. These data are important because measurement of those datapoints are not affected by exogenous effects, such as the urban heat island effect or other problems that affect ground-level temperature readings. They are thus the most accurate recordation of temperature and can reasonably be used to test the models.
Again, the models are complex and numerous. The simplest way ascertain whether the models are correctly modeling future events is to test their predictions to observed data. Fortunately, such a comparison has been done. The chart here is from the testimony of Dr. John Christy, graphing the averaged runs of several climate models and the mid-tropospheric observed temperatures:
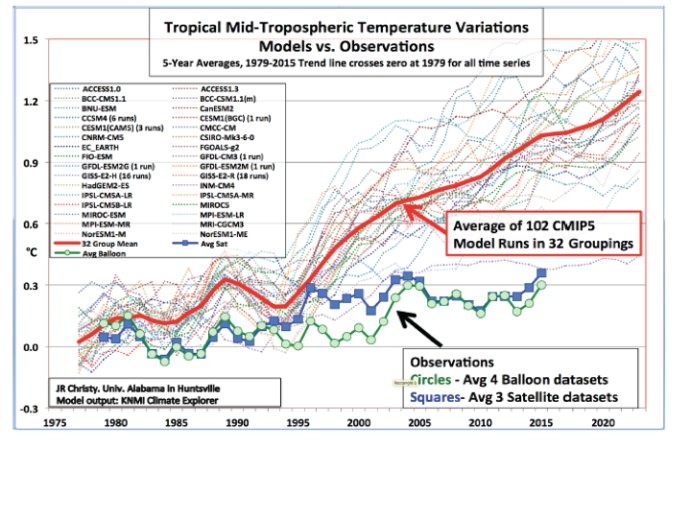
The graph shows us that most of the models diverge sharply from the observed data around 1995 and increasingly disagree with the observed data. From that, we can conclude that the models, at least in the limited aspect of predicting mid-tropospheric temperatures, are not useful in predicting future climate.
That begs the hardest question: why do the models fail to accurate predict mid-tropospheric temperatures? My answer – I don’t know. I suspect that the models’ estimates of both the solar irradiance and albedo are too low, and the value for carbon forcing is too high. The combination of these is sufficient to drive the model predictions out of wack with the observed data. Clearly, more research is needed.
I’ve long suspected that the effect of the sun on terrestrial climate has been poorly understood. Recent Mars missions have noted some changes in the climate on Mars. While this is a poorly-understood phenomenon, speculation is that changing outputs from the sun are having an effect on Martian climate. If that is accurate (and there is very little data to support or contradict such a claim), then solar irradiance would likewise have an effect on terrestrial climate.
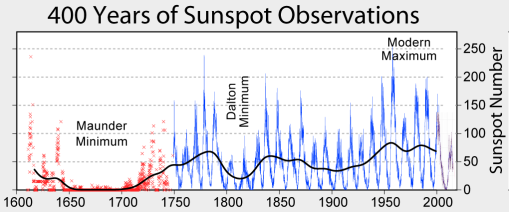
Solar activity is variable. Sunspot activity have been used as a proxy for solar activity, and the records for sunspot observations are, if not robust, fairly extensive. What is known is that periods of low solar activity correspond to recent temperature declines, while periods of high solar activity correspond to recent temperature increases.
Current solar observations indicate that solar activity is trending downward. However, the reasons for increasing and decreasing solar activity is poorly understood and clearly need additional study. Which is where something I read recently come in. Research by Dr. Valentina Zharkova, a researcher at the University of Northumbria, has created what she refers to as a “solar dynamo” model. Dr. Zharkova, who has a BSc/MSc in Applied Mathematics and Astronomy, a Ph.D. in Astrophysics, posits that there a complex but repeating cycle of solar activity that is driven by several independently-occurring cyclic occurrences. A very nice explainer of Dr. Zharkova’s theory was created by Stephanie Osborn, a science fiction writer with graduate and undergraduate degrees in four sciences: astronomy, physics, chemistry and mathematics. I include it here because it’s really interested and bears significantly on the question of the correlation between solar activity and terrestrial climate effects.
Dr. Valentina Zharkova has come out with more information and an enhanced solar dynamo model. Her team proposed the double-dynamo solar model back in 2015, a model which contained one dynamo in the upper layers of the Sun, and another in the deeper layers. Each one of these was a basic magnetic dipole, but we knew at the time it was not a perfect fit to observations, and I remember discussions in which I said it was good, but there would be more components needed before the model would adequately ‘predict’ all the known extended solar minima. Zharkova has now done so, by incorporating an additional quadrupole magnetic component, likely arising out of the Coriolis-affected convection currents within the Sun. This updated model now predicts extended minima rather well, and it is becoming obvious that there are several periodicities of variability, which sometimes ‘interfere’ constructively, and sometimes destructively, generating ‘beat’ modes. It is during the destructive interference that the extended minima occur.
There have been many periodicities suggested over the years, but Zharkova’s research confirms what appear to be three principal periods. They are as follows:
• The standard magnetic cycle = ~22 yrs;
• The Gleissberg cycle = ~90-110 yrs, avg. 100 yrs;
• The ‘Grand’ cycle = ~350-400 yrs.
(NOTE: the typical 11-year sunspot cycle is actually only half of the full cycle; sunspots are magnetic and usually dipolar in nature. They often occur in pairs, with one spot the north pole, the other the south; even when only a single spot occurs, one side will be N, the other S. The polarity is reversed in the southern hemisphere relative to the northern, and at the end of a single sunspot cycle, the sunspot polarity – as well as that of the whole Sun – flips, often in a very convoluted fashion. It therefore takes two full sunspot cycles before the magnetic field is back in the same orientation, and thus the true period is 22 years.)
This means that we have two slightly out-of-phase dipole dynamos, with periods around 22 years (but they do not have the SAME periods, which means that they slowly move in and out of phase over time, like windshield wiper blades that are out of synch), PLUS a quadrupole wave arising from the inner dipole dynamo (and the Coriolis’ed convection current gyres coming from it) generating a roughly 100-year periodicity. Combining the beat effect from these three results in the ‘Grand’ period of ~350-400 yrs.
Zharkova’s model is supported not only by sunspot numbers and solar activity, but by other solar-studies fields: magnetohydrodynamics and helioseismology. In fact, the resulting data plots from these fields are so close to Zharkova’s model predictions, that the model could as well be based on either of those. So this model is not functioning in isolation from related science, but is in fact harmonizing quite well with it.
The Dalton extended minimum (1790-1830) is evidently an example of a Gleissberg minimum, while the deep and protracted Maunder minimum (1645-1715) was the previous ‘Grand’ minimum. It has been roughly 350 years since the onset of the Maunder minimum, and a bit over 200 years since the Dalton minimum began. Zharkova et al. also noted a moderate Gleissberg minimum in the earliest part of the 20th century, as well, so the periodicity for that cycle seems to be holding.
The gist of the matter is that all three main cycles are entering minimum phase, beginning with the end of this current solar cycle (Cycle 24). Cycle 25 will be even lower than 24, with 26 being very nearly flat-lined. Cycle 27 will begin to show a few signs of life, then there will be a gradual rise to full activity over several more solar cycles, even as the last three cycles have slowly decreased in levels. This means that the bottom of the extended, or ‘Grand’ minimum (to use Zharkova’s terminology), should run from ~2020 to ~2053. (NO, it will NOT last 400 years like some are reporting – that is the overall length of the Grand cycle, not the predicted length of the minimum.)
In terms of atmospheric interaction, certainly the majority of the solar radiation peaks in the visible range, and that changes little, and the atmosphere is largely transparent to it. Once it strikes a solid object, however, the photon’s energy is absorbed, and later re-radiated as infrared (IR), which the atmosphere largely blocks (at least in certain frequency windows), so it does not all radiate off into space at night.
But it turns out that higher-energy photons have a fairly strong correlation with the solar cycle; this includes ultraviolet (UV) and X-ray, most notably extreme UV or EUV, which borders the X-ray regime. Much of this photonic radiation is generated in the inner solar corona, which again, strongly follows overall solar activity; much of the rest is produced during flare activity – which is PART OF solar activity. More, unlike visible light, this frequency regime is ENTIRELY absorbed in the upper atmosphere (exosphere, thermosphere, ionosphere). So during high solar activity, the EUV and X-ray radiation hitting Earth has 100% of its energy injected into the atmosphere. During low solar activity, there is considerably less energy from this high-frequency regime being injected into the atmosphere – according to NASA research I dug up in the course of researching her papers and presentation, it may completely bottom out – as in, essentially zero energy from EUV etc.
But that isn’t the only way this might affect Earth’s atmosphere. It turns out that the solar wind/corona effects shield the inner solar system from cosmic rays, which are very high energy particles coming in from cosmological sources, such as supernovae, quasars, pulsars, etc. As solar activity diminishes, the solar wind decreases in effect, and the cosmic ray flux (‘flux’ is a measure of number of units per square area, e.g. number of cosmic ray particles per square meter) increases. BUT we know that cosmic rays tend to hit atmosphere and ‘cascade’ – generate a shower of particles, rather like a branching domino effect – and this, in turn, tends to create condensation nuclei around which clouds can form. (In fact, our first cosmic ray detectors were so-called ‘cloud chambers’ where the formation of condensation clouds depicts the track of the particle.) As a result, increasing cosmic ray fluxes are apt to generate increased cloud cover; increased cloud cover will then block visible light from reaching Earth’s surface and adding energy to the overall system. And cosmic ray flux can vary by as much as 50% with solar variation.
Well, then. So. What effects are being seen as a result of these two items?
Well, the undeniable INCREASE in cosmic ray flux has been followed for some years. And it’s pretty much worldwide. (http://spaceweather.com/archive.php…)
And the outer layers of the atmosphere have already cooled, according to researchers at NASA’s Langley Research Center. (http://spaceweather.com/archive.php…) (Original journal article: https://www.researchgate.net/…/324366650_Thermosphere_clima…) According to Langley researchers, we are on the verge of seeing “a Space Age record” for a cold thermosphere.
So far, Zharkova appears to be batting 1.000.
According to her research of the correlation with the Maunder minimum (the previous Grand minimum), temperatures dropped by about 0.1%, or about 1.3°C, or some 2.34°F. Granted, the Maunder minimum lasted about 70-80 years, as opposed to the estimated 30-some-odd that Zharkova is predicting, so it might not be THAT deep a delta. But if it really drops a significant amount (and remember, we’ve had that annoying ‘warming plateau’ going on through the last couple of solar cycles, which have been steadily decreasing in activity; certain groups want really bad for THAT to go away), then it WILL still be noticeable. And possibly unpleasant.
There’s one other factor that she looks at, that isn’t related to the dynamos inside the Sun but DOES affect the solar irradiance (power per unit area coming from the Sun). The irradiance is following the Zharkova team’s curves, regardless of what the human civilization does – it’s falling out completely separately. And it is varying.
NOTE: solar irradiance used to be called the ‘solar constant.’ But astronomers discovered it was NOT constant, and stopped using the term. Climate models often still use it, however, and do not take into account the variability of the solar irradiance, which is small, but distinct and measurable.
That ‘other factor’ which affects solar irradiance is what might be termed ‘barycentric wobble,’ and appears to be one of the things confusing many of the reporters, who are interpreting it as a change in orbit of either the Earth or the Sun…when it is neither.
See, one of the ways we look for exoplanets in other stellar systems is to look for the very small wobble in proper motion (aka movement through the galaxy) of the star, which is caused by the gravitational tug of the orbiting planet(s). And our planets do the same thing to the Sun. (The barycenter is the effective center of mass of two co-orbiting objects – a binary system – and it is the point about which those objects orbit, no matter how big the objects. The barycenter itself remains relatively stationary relative to the objects, however; in the case of a translating system, the barycenter travels in a straight line, with the objects orbiting around it.) In the case of most of the inner planets, the barycenter lies well inside the Sun. But Jupiter is massive enough that the barycenter lies roughly 50,000km (~31,000mi) above the photosphere, and the other gas giant planets would have barycenters with the Sun that are substantially displaced from the center of the Sun, too. So the Sun has a reasonable ‘wobble,’ and this movement can bring it marginally closer to Earth at certain points in the orbit.
As a consequence of this barycentric wobble, if the Sun moves closer to Earth’s perihelion (closest approach to the Sun in our elliptical orbit), then we would expect to be ever so slightly warmer near perihelion, and cooler near aphelion (farthest distance from the Sun in orbit). It so happens that the perihelion occurs about 2 weeks after the Northern Hemisphere winter solstice, and aphelion occurs about 2 weeks after the Northern Hemisphere summer solstice. This would mean that the Northern Hemisphere’s summers would be marginally warmer, and likewise the Southern Hemisphere’s winters would be marginally less cold. Six months later, the Northern’ Hemisphere’s winters would be slightly cooler, and the Southern Hemisphere’s summers would also be slightly less hot. Then, as the wobble finishes its cycle, the Sun would move away from the perihelion region and closer to the aphelion region, and the opposite would occur. And this is all a function of orbital mechanics, and has nothing to do at all with anything humanity may or may not do. It is not a large factor, and it is vastly outweighed by the overall magnetic cycle variability (it’s something like only 0.05 times the magnetic cycle variability effects), but it is there, and it is apparently showing up in the irradiance data.
This is NOT, let me reiterate, a change in Earth’s orbit, nor is it a change in the Sun’s motion – this has been going on ever since the solar system has been here. But we are only now getting good enough with our observations and modeling to observe its effects and take them into account.
Zharkova indicates she is not done with the dynamo model; she intends to continue refining it, adding terms as needed as she and her team explore additional non-visible light regimes (notably X-ray, gamma ray, infrared, microwave, and radio). This will likely result in an excellent solar activity predictive tool. It all makes a great deal of sense to me, and it is the first time that a model has ever accurately predicted such long-range activity.
As I see it, solar activity is a primary driver of terrestrial climate change. The models do nott give sufficient weight to solar irradiance and changes in albedo and as a result provide inaccurate climate predictions. While there are anthropogenic effecets, I believe they are minor compared to solar effects. Additionally, within those anthropogenic effects, carbon emissions are an even smaller component of climate effects and the emphasis placed on restricting those emissions are driven by political considerations and not by any reasonable claim of effecting a change in terrestrial climate.
Models that do not accurately account for solar irradiance are ineffectual in accurately informing policy decisions, and therefore, the policy decisions based on them are inherently flawed and will be ineffective in addressing changing climate conditions. Does that mean we should be free to do as we will, increasing carbon emissions willy-nilly? Of course not. Reasonable steps need to be taken reduce carbon emissions. In fact, the US, while not a signatory to most of the major climate agreement, has nonetheless been a world leader in reducing carbon emissions.
According to the 2017 BP Statistical Review of World Energy, since 2005 annual U.S. carbon dioxide emissions have declined by 758 million metric tons. That is by far the largest decline of any country in the world over that timespan and is nearly as large as the 770 million metric ton decline for the entire European Union.
By comparison, the second largest decline during that period was registered by the United Kingdom, which reported a 170 million metric ton decline. At the same time, China’s carbon dioxide emissions grew by 3 billion metric tons, and India’s grew by 1 billion metric tons.
Forbes, October 2017 The reduction in US emissions, despite not having a carbon tax, an effective carbon trading scheme or any other of the usual nostrums prescribed for climate rescue, was primarily driven by the conversion of coal plants to natural gas and natural changes in energy usage patterns. Additionally, replacing existing carbon-emitting powerplants with truly sustainable alternatives, like thorium-based nuclear reactor powerplants and hydro, can further lower carbon emissions. However, it does not appear that the situation is as dire as the models lead one to believe, providing additional time to perfect alternatives.
In the meantime, we have been provided with an excellent natural experiment. Dr. Zharkova’s theory predicts that there will be a Grand minimum is solar activity between 2020 and 2053. If the theory that solar irradiance is a primary driver of terrestrial climate, we should see evidence of that in the mid-trophospheric temperature observations. If we do, then the current models deserve another look to see how they can be modified to reflect the observed data.** In turn, that will lead us to a better understanding of the human effect on climate and better-informed policy decisions.
* Anyone who use the phrase “the science is settled” to shut down a debate is engaged in scienceism, not science. Science is a process, and the scientific method involves testing and retesting a hypothesis and adjusting the hypothesis based on the data obtained from experiment. Scienceism, instead, mandates that the data must be reformed to fit the hypothesis and condemns questioning of the underlying logical basis of the hypothesis. Scienceism is sham and fascistic in nature and should be eschewed by all right-thinking people. Begone, scieneism!
** In fact, there is one model that closely correlates with the observed data, the Russian INM-CM4 model. It predicts a modest 1.4 degree C increase in average temperature by 2100.


